last updatedMonday, May 20, 2002
Procedure to retrieve data from GC-MS computer in MS lab
1. Identify an the unknown using a GC-MS and NMR spectroscopy (will discuss how to do this in lecture).
2. Do a Molecular Modeling Assignment using PC Spartan (which you will do during your lab period).
Questions:
1. Compound W is either carbon monoxide, nitrogen (N2) or ethene. Could low resolution MS be used to identify compound W? Yes or No Explain. huh
2. Referring to question #1, could compound W be identified if high resolution MS was used? Explain.
Molecular Modeling Assignment (do this during your lab period).
See the Science Learning Center Room Reservations link for room assignment for this problem set.
I. PART ONE: DRAW STRUCTURES and SAVE
Start up PC_SpartanPro and draw each of the following structures.

After each structure is drawn, don't forget to minimize and then save.
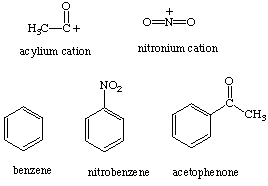
A. drawing the acylium ion:
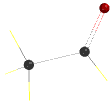
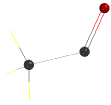
First, draw the above structure and then delete the valence electron on the carbonyl group
should look like this
Minimize structure and then save.
B. drawing the nitronium ion will require using the expert drawing palette. Select Nitrogen, -x-, and single bond (as shown below).
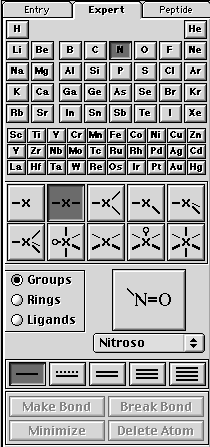
Now click on the screen and you should get something like this —N— (note: the "N" will be a sphere).
Next, select the Oxygen, —X and double bond as shown below.
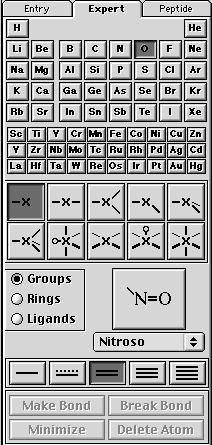
Now click on the valence electrons on —N— and you should have something that looks like O—N—O. Save this as nitronium_cation. Minimize structure and then save.
B. drawing the remaining structures (benzene, nitrobenzene, and acetophenone) and save them (these should be fairly easy to draw).
II. PART TWO: Electrostatic Potential Maps and Molecular Charge Distributions for the Acylium and Nitronium ions.
Introduction:
Both the acylium and nitronium ion are synthetically useful elctrophiles.
Electrostatic potential maps help identify the charge distribution in these molecules. Positively charged sites (electron poor) in the molecule will be indicated by the color, BLUE. Negatively charged sites (electron rich) in the molecule will be indicated by RED.
In summary, when examining an electrostatic potential Map:
BLUE = electron poor
RED = electron rich
A. Generation of Electrostatic Potential Map for the acylium cation.
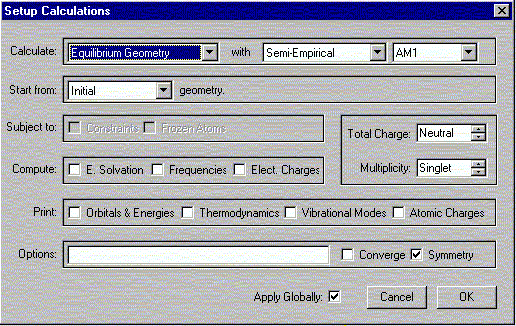
Call up the acylium cation file. Under the Setup menu, select Calculations.

A window should appear. In this window, select the following:
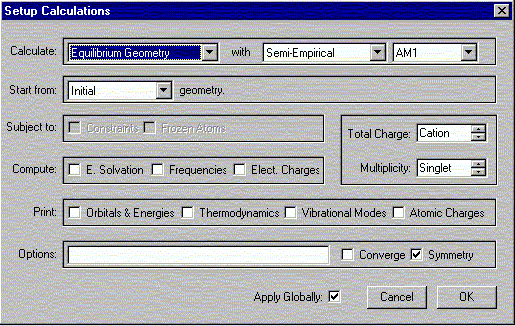
Click OK to close the window. Under the Setup menu, select Surfaces. A window should appear. In this window click Add.
:
A second window should appear. In this window, select the following
Click OK. Close the "Surface List" window.
Under the Setup menu, select Submit. Wait until you get a message indicating that the calculation is done.
B. Displaying the Electrostatic Potential Map for the acylium cation.
Under the Display menu, select Surfaces.
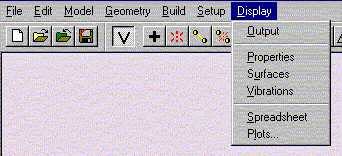
A window should appear. In this window check the yellow box. Next, select the molecule by clicking on it. In the bottom right corner of the window, change the selection from Solid to Transparent.
You should get something that looks like the following:
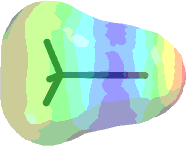
but in better color detail than what is shown here.
Either print or sketch the molecule showing the electrostatic potential map. The printout will be in black and white so you should touch it up with pen indicating the blue and red regions.
C. Generation of Electrostatic Potential Map for the nitronium ion.
D. Generation of Electrostatic Potential Map for the benzene, nitrobenzene, and acetophenone.
The same protocol will be used here as above for generating the electrostatic potential maps, however, with one critical exception. The only change occurs under Under the Setup menu, select Calculations. Here Total Charge = Neutral. Everything else is the same as before.
III. PART THREE: QUESTIONS
1. Referring to the electrostatic potential map for the acylium ion, which atom is the most positively charged? Which atom (carbonyl carbon or oxygen) would be susceptible to nucleophilic attack?
2. Referring to the electrostatic potential map for the nitronium ion, which atom is the most positively charged? Which atom (nitrogen or oxygen) would be susceptible to nucleophilic attack?
3. Is the nitronium linear or bent? Does this agree with resonance theory?
4. How about the acylium ion (linear or bent)? Does this agree with resonance theory?
5. Is the calculated geometry of the acylium ion consistent with the Lewis Structure?
[Hint 1: to determine the atom bond distances in PC_Spartan Pro go under the Geometry menu and select Distance]
[Hint 2: Compare CO bond distances]
CC and CO Bond Distances
C-C
1.54 Å
C=C
1.32 Å
CC triple bond
1.20 Å
C-O
1.35 Å
C=O
1.22 Å
CO triple bond
1.12 Å
6. Compare the electrostatic potential maps for benzene, nitrobenzene and acetophenonee. Which of these molecules contains the most electron-rich ring? least electron-rich ring?