last updated
NMR simulations (has to be done in the SLC because the ACD program is not available elsewhere on campus!)
Goals:
1. The purpose of this assignment is to analyze the splitting patterns of various isomers and to observe the changes in spectra when the structure changes.
2. Prediction of chromatographic results using the log P (=log Kow) values
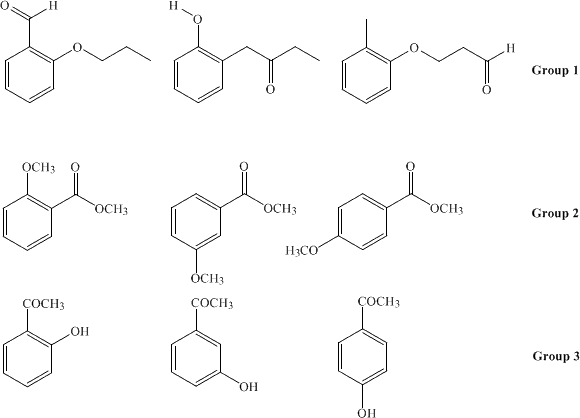
The assignment is mandatory and is done during the second half of the lab period in meeting 9 in the SLC. The assignment is due during your in-lab meeting in the meeting 10 in your lab notebook (credit: 10 points). Using Chemdraw and the ACDlabs 2012 LSM Software, simulate and analyze the the spectra for the following compounds:

Generating the molecules
In order to draw these compounds, you will have to use ChemSketch (ACD Software). Try to make use of the existing templates available in the program i.e., benzene, etc. Otherwise, the drawing process is similar to the one in Spartan. However, you cannot draw the molecule in Spartan and then copy it over because the two programs use different data protocols!
To expand an area, click both mouse buttons. A crosshair appears on the screen and a second screen on the top. Define the left edge by moving the cursor to the left side and clicking the left mouse button. Then hold the left mouse button and drag the cursor to the right and click again. A dark gray field will move with the cursor to highlight the area to be expanded. Alternatively, you can also drag the markers on the top window to define the range.
1H-NMR spectra simulations:
1. After you draw the molecules, highlight the molecule and go to "ACD/Labs-C+H NMR Predictor" to start the appropriate. Pick the "Calc HNMR" feature to simulate the H-NMR spectrum. Set the default frequency to 400 MHz in the beginning. (Options-Default Basic Frequency-400).
a. For group 1, analyze the peak locations and the splitting pattern for the aliphatic range. Rationalize the differences.
b. For group 2, analyze the splitting pattern of the aromatic range. Compare the obtained spectra with the literature spectra that can be found on www.sigmaaldrich.com, www.sdbs.com, etc. Do not use spectra here that have been simulated on a different website!
c. For group 3, analyze the splitting pattern of the aromatic range and rationalize the locations for the OH signal in each spectrum (Hint: Double-click with the right mouse button on the OH group to get the exact chemical shift of the OH group because sometimes it does not appear as an obvious signal or outside the normal window being shown)
2. Next, change the Default Basic Frequency to 60 MHz and recalculate the spectra for group 2. What changes in the spectrum? How can the change be rationalized? Which of these frequencies (60 or 400 MHz) produces more useful data? Why?
3. Using the molecules of group 1, activate the Integration feature in the Show-Integral curve. Can you account for its shape and the steps observed?
4. For 2-hydroxyacetophenone determine the coupling constants (J3, J4 and J5) for the hydrogen atom adjacent to the the acetyl function by using Show-Table of Coupling Constants. What do these numbers mean in terms of the appearance of the signal for this proton in the H-NMR spectrum?
13C-NMR spectra simulations (use 400 MHz frequency only)
1. Pick the "Calc CNMR" feature to simulate the C-NMR spectrum. Compare the different substitution patterns in the 13C-NMR spectrum of the molecules in group 2. (All generated spectra are proton-decoupled. using )
2. If you check the Tools- Off-Resonance feature, the decoupling feature is deactivated. How do the spectra change? Which conclusion can you draw from this type of spectra?
3. The program also allows you to do a "virtual lab". In the C-NMR module, go to the Show-Solvent lines item. A window pops up that allows you to change the solvent, its quantity and the sample weight. (Uncheck the Off-Resonance feature first!).
a. Using the Show-Solvent lines feature prepare a solution of 1 mg of 4-hydroxyacetophenone in 1.0 mL of CDCl3 (Don't forget to check the box on the top!). How does the spectrum look like?
b. Next, change the concentration to 50 mg of 4-hydroxyacetophenone and 1.0 mL (CD3)2CO. Which changes do you observe in the spectrum? Rationalize this observation.
Chromatography:
1. Using the LogP simulator (Add-ons), determine the log P values for 2-hydroxybenzaldehyde, 4-hydroxybenzaldehyde, 2,6-dihydroxybenzaldehyde and 3,4,5-trihydroxybenzaldehyde. Based on these values, determine the elution sequence of the five compounds on a non-polar stationary phase (i.e., C18) with mobile phase of MeOH:H2O (1:1).
Report:
1. Include all spectra (including their expansion if needed) simulated in this exercise (Hint: copy them into the report editor and from there into a word file (saves paper printing them out!).
2. Answer the questions above and rationalize the splitting patterns in the spectra.
3. The report for this project is due during meeting 10 (worth: 10 points). This assignment is mandatory!